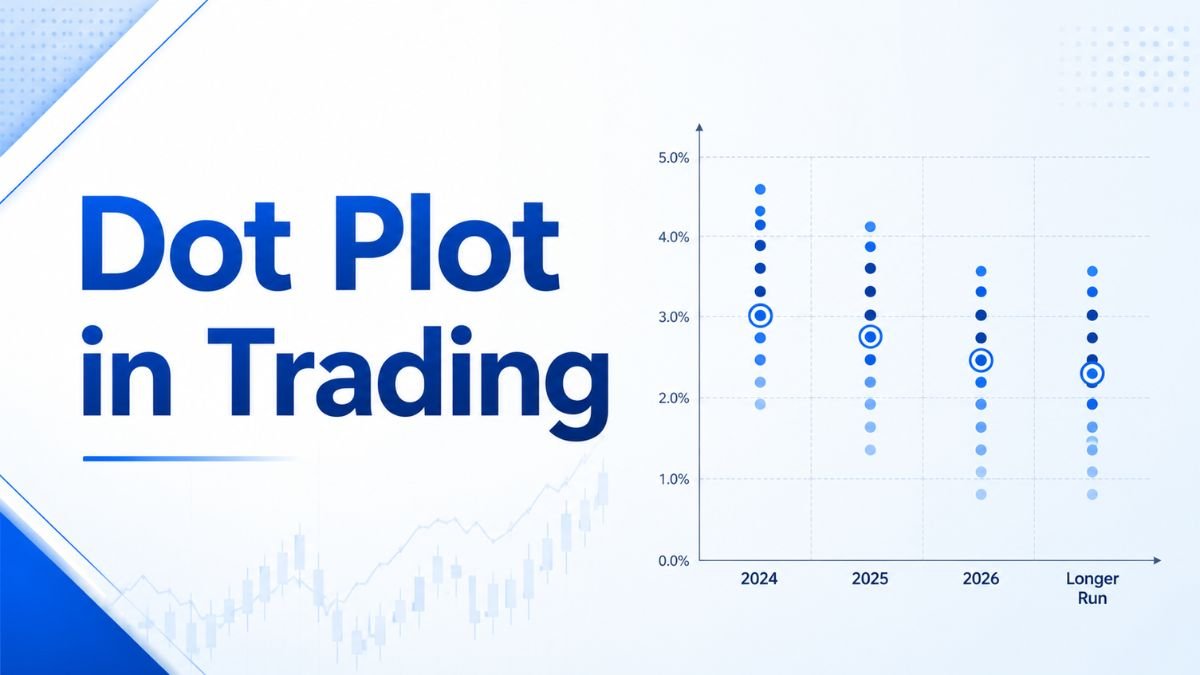
While predicting the Federal Reserve’s next interest rate move with certainty is impossible, the Fed provides tools that offer valuable clues. Chief among them is the Fed dot plot—a visual roadmap showing where top central bank officials expect interest rates to head over the next few years.
Published quarterly, the chart isn’t an official guarantee or binding forecast, but it is one of the most closely watched indicators in finance.
What Is the Fed’s Dot Plot?
The dot plot is a chart displaying interest rate projections from members of the Federal Open Market Committee (FOMC)—the Fed body responsible for setting monetary policy.
- 19 Anonymous Predictions: Each dot represents the individual, anonymous prediction of one of up to 19 FOMC participants (the Fed Board of Governors and regional Reserve Bank presidents).
- Updated Quarterly: Projections are revised every March, June, September, and December as part of the Fed’s Summary of Economic Projections (SEP).
- Origins: Introduced in 2012 to enhance transparency and improve communication with the public and financial markets.
How to Read the Chart
At first glance, the dot plot can look like a random scatter, but it follows a simple structure:
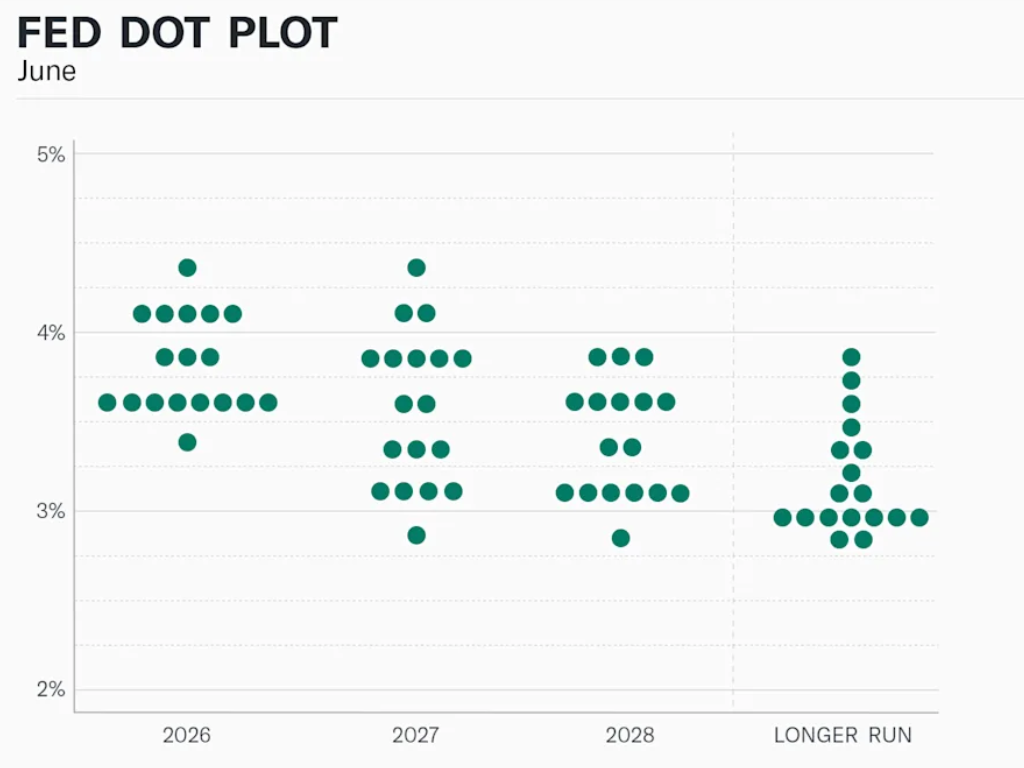
| Chart Axis | What It Shows |
| Y-Axis (Vertical) | The target range percentage for the federal funds rate. |
| X-Axis (Horizontal) | Timeframes, including the end of the current year, the next two to three years, and the “longer run” (the projected steady-state rate assuming no economic shocks). |
Key Focus: Analysts and markets look primarily at the median dot for each year to gauge the consensus direction of policy.
What Information Does It Provide?
While the plot reflects educated guesses rather than set plans, it helps investors and consumers:
- Identify Trends: See whether the overall policy bias is leaning toward rate cuts, rate hikes, or holding steady.
- Gauge Consensus: A tight cluster of dots signals high agreement among members, while widespread scatter highlights internal debate over economic conditions.
- Inform Financial Strategy: Anticipate broader shifts in borrowing costs and investment environments.
Limitations: Why the Dots Aren’t Set in Stone
Before altering your financial strategy based on the chart, keep its key limitations in mind:
- Low Historical Accuracy: The chart is only moderately reliable for short-term (1-year) outlooks and notoriously inaccurate for predictions two or more years out. As Fed Chair Jerome Powell put it: “The dots are not a great forecaster of future rate moves.”
- Data-Dependent Policy: The Fed influences the economy; it doesn’t control it. Shifts in inflation, employment, supply chain issues, geopolitical conflicts, or tariff changes can instantly alter the policy path.
- Diverging Internal Views: As you look further out on the timeline, FOMC members‘ forecasts vary significantly, reflecting deep disagreement about long-term economic conditions.
The Bottom Line
Use the Fed’s dot plot as a directional compass rather than a definitive forecast. For a more complete picture of where monetary policy is heading, combine it with other signals, such as the official FOMC Meeting Statements, the yield curve, and full economic projection reports.
A: The dots are submitted anonymously by members of the Federal Open Market Committee (FOMC). This group includes up to 19 top Fed officials—the 7 members of the Federal Reserve Board of Governors and the 12 regional Federal Reserve Bank presidents. While you can see the overall spread of their interest rate predictions, individual names are never attached to specific dots.
A: The dot plot is updated four times a year (quarterly) in March, June, September, and December. It is published as part of the Federal Reserve’s Summary of Economic Projections (SEP), which is released alongside the FOMC’s interest rate policy decision.

Suresh holds a Master of Commerce (M.Com) degree and is a dedicated personal finance researcher and writer. Combining his advanced academic background in commerce with deep industry research, he covers complex topics like taxation, banking systems, credit analysis, and personal finance strategies. As the founder of Tax Assistant (taxassistant.org), Suresh is committed to translating complicated financial guidelines and economic data into simple, accurate, and actionable educational resources for everyday readers.