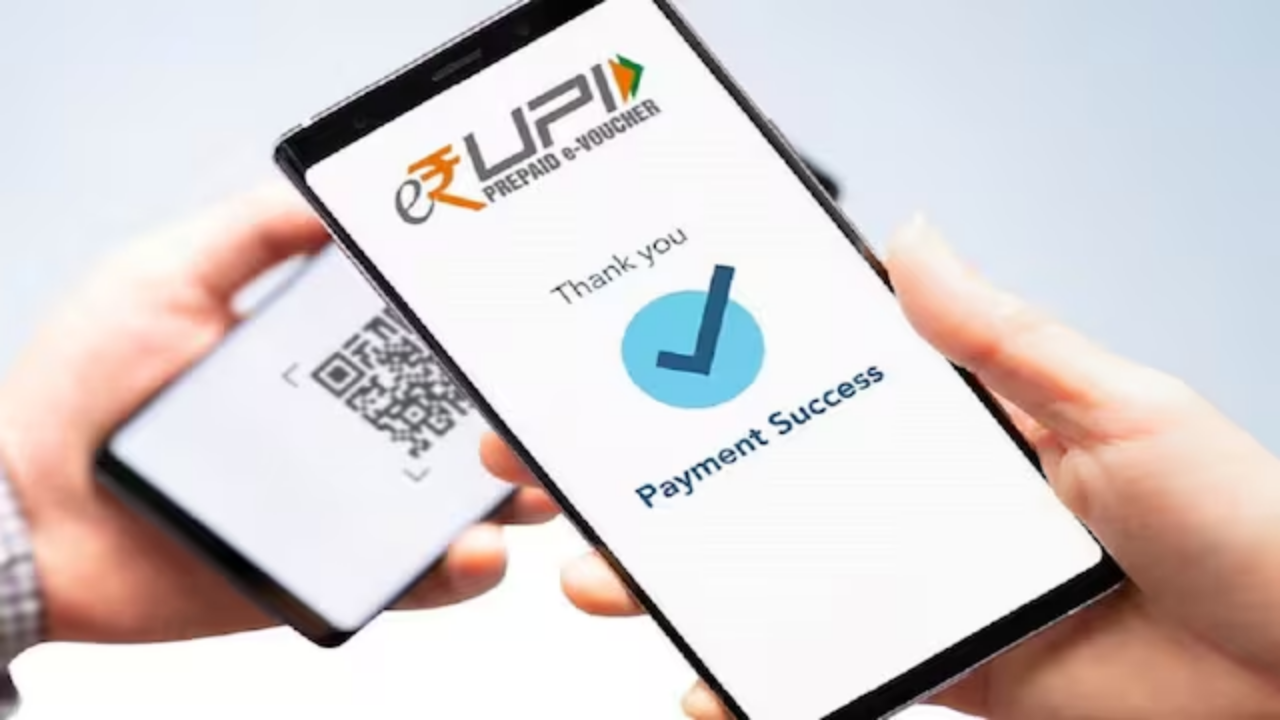
In July 2025, India’s Unified Payments Interface (UPI) hit a new high, with a staggering 19.46 billion transactions valued at over ₹25.08 lakh crore. The data from the National Payments Corporation of India (NPCI) shows how UPI has become an integral part of daily life, from small purchases to major bill payments.
Thank you for reading this post, don't forget to subscribe!The Breakdown: P2M vs. P2P
The way Indians used UPI in July 2025 was split into two main categories:
- Peer-to-Merchant (P2M): This made up the lion’s share, accounting for 64% of all transactions. People used UPI for 12.38 billion payments to businesses, whether for groceries, food, or services.
- Peer-to-Peer (P2P): The remaining 36% were person-to-person payments, totaling 7.08 billion transactions.
Where People Spent Their Money
While the number of transactions was highest for everyday items, the total value of transactions was driven by different categories.
Top Categories by Transaction Volume:
- Groceries and Supermarkets: 3.03 billion transactions
- Fast Food Restaurants: 1.22 billion transactions
- Eating Places and Restaurants: 1.15 billion transactions
- Telecommunication Services: 871.88 million transactions
- Service Stations: 612.49 million transactions
Top Categories by Transaction Value:
- Debt Collection Agencies: ₹93,857.47 crore
- Groceries and Supermarkets: ₹64,881.98 crore
- Service Stations: ₹35,188.88 crore
- Utility Bill Payments: ₹23,497.63 crore
- Telecommunication Services: ₹21,628.80 crore
UPI Across India
UPI usage was particularly strong in certain regions. The top five states leading in transaction volume were:
- Maharashtra: Over 1.9 billion transactions
- Karnataka: 1.06 billion transactions
- Uttar Pradesh: 1.03 billion transactions
- Telangana: 791 million transactions
- Tamil Nadu: 778 million transactions